Project factsبيانات المشروع
Power BI
To be added
1. Project overview١. نظرة عامة
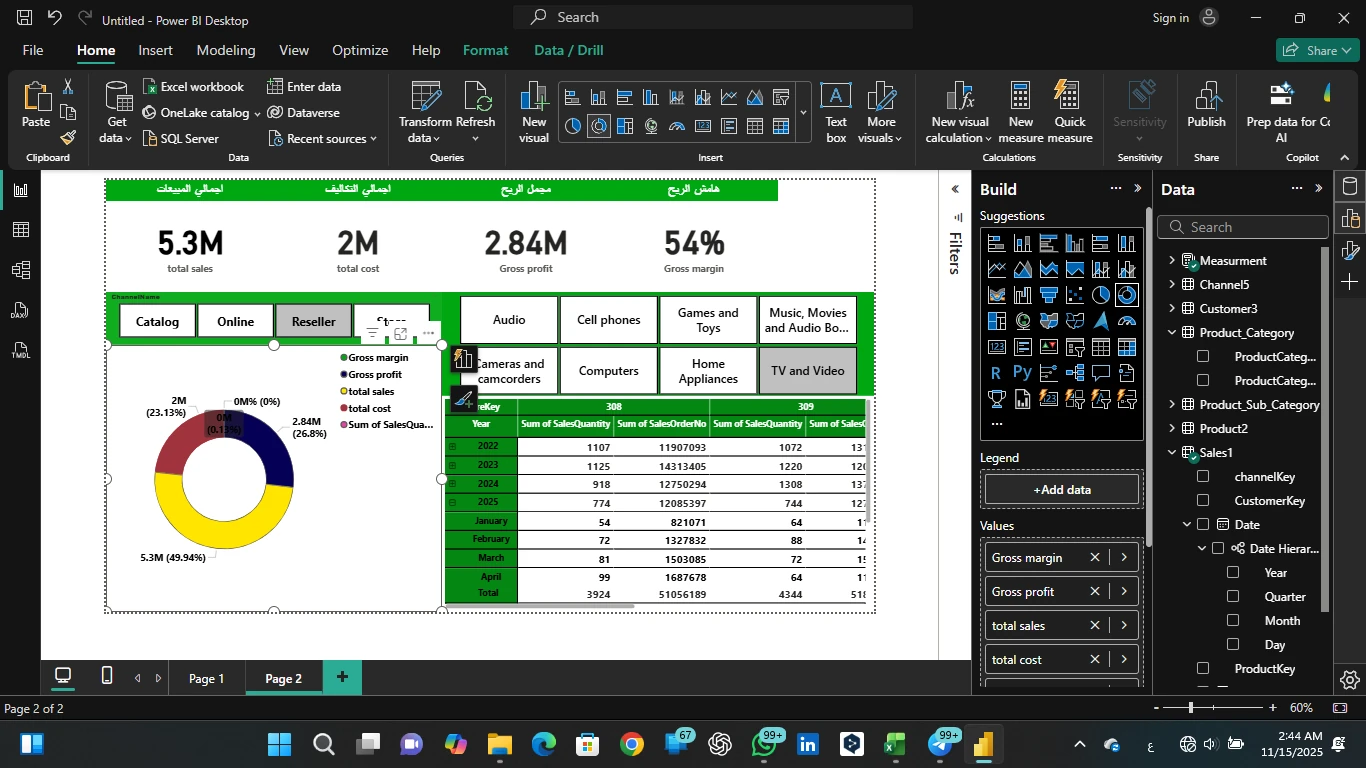
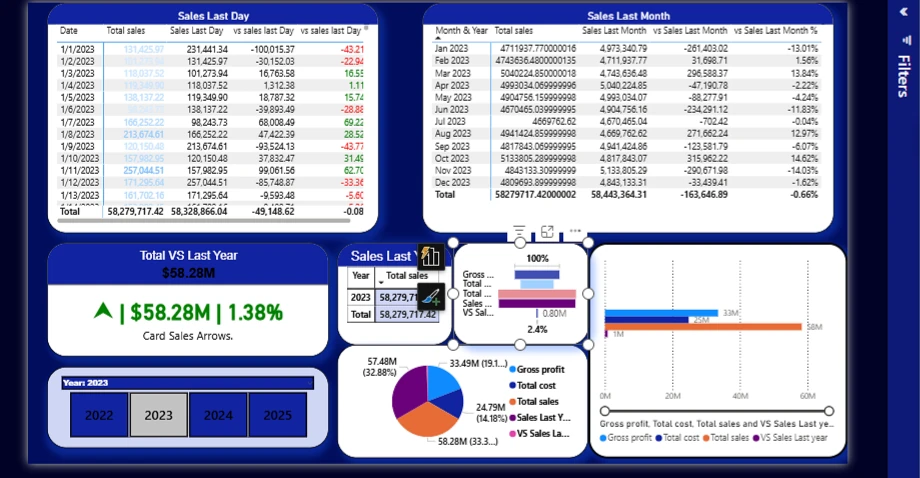
The supplied screenshots document a Power BI practice report with KPI cards, comparison tables, slicers, category and channel visuals, and a decomposition tree. The original dataset source, project date and exact division of work have not been supplied.توثق لقطات الشاشة المرفقة تقريرًا تطبيقيًا على Power BI يضم بطاقات مؤشرات وجداول مقارنة ومرشحات ورسومًا حسب الفئة والقناة وشجرة تحليل. لم يُحدد بعد مصدر البيانات الأصلي أو تاريخ المشروع أو تفاصيل توزيع العمل.
2. The challenge / business problem٢. التحدي / مشكلة العمل
Create a clear way to review sales performance across time, product categories, channels and sales hierarchy. The original business brief and dataset context are to be added.إنشاء وسيلة واضحة لمراجعة أداء المبيعات عبر الزمن وفئات المنتجات والقنوات والتسلسل البيعي. سيُضاف لاحقًا موجز العمل الأصلي وسياق مجموعة البيانات.
3. Objective٣. الهدف
Present total sales, total cost, gross profit and gross-margin indicators, then support period comparisons and drill-down exploration through interactive report views.عرض مؤشرات إجمالي المبيعات وإجمالي التكلفة ومجمل الربح وهامش الربح، مع دعم المقارنات الزمنية والاستكشاف التفصيلي من خلال صفحات تقرير تفاعلية.
4. Approach٤. المنهج
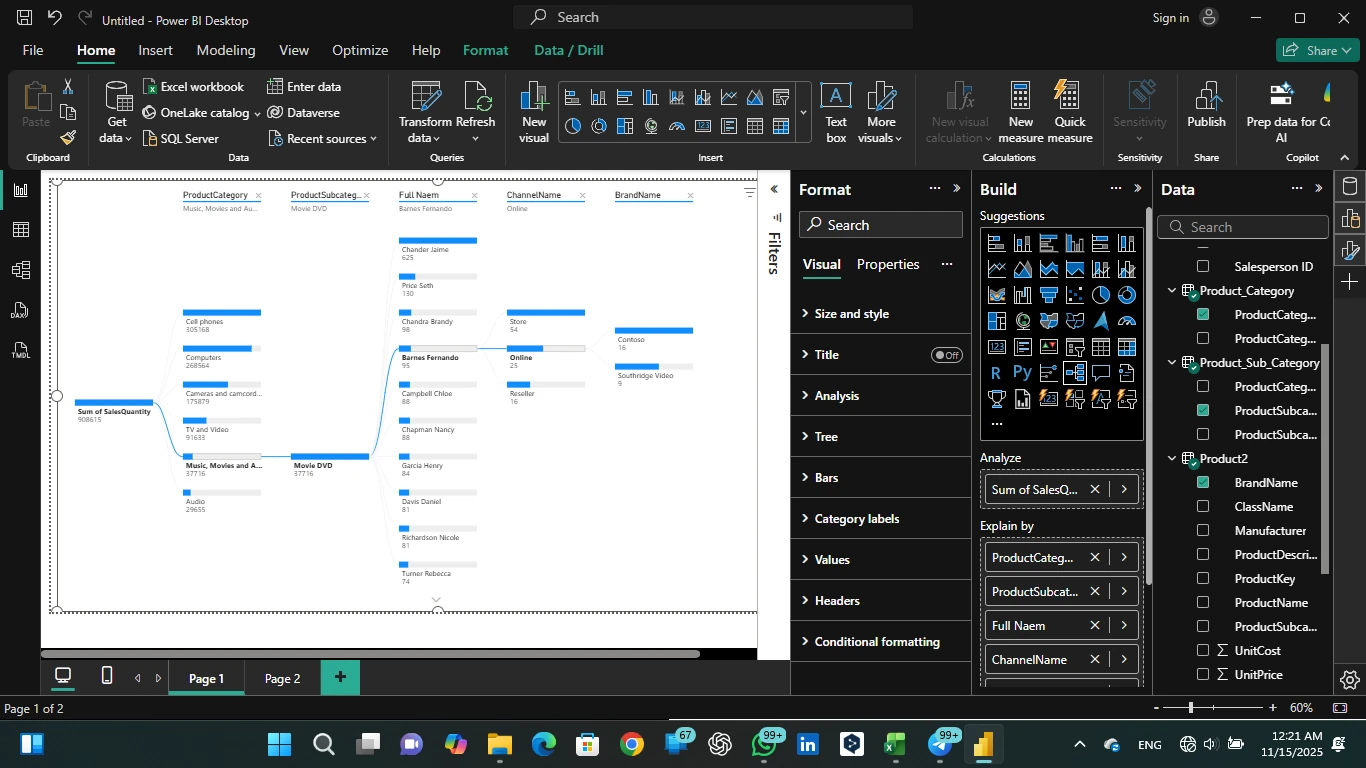
The report is structured around high-level KPI cards, detailed comparison tables, slicers for time and category selections, channel and category charts, and a decomposition tree for progressive exploration. Data preparation steps, model relationships and measure definitions are to be documented.بُني التقرير حول بطاقات مؤشرات رئيسية وجداول مقارنة تفصيلية ومرشحات للزمن والفئات ورسوم حسب القناة والفئة وشجرة تحليل للاستكشاف التدريجي. ستُوثق لاحقًا خطوات تجهيز البيانات وعلاقات النموذج وتعريفات المقاييس.
5. The solution٥. الحل
A multi-view Power BI practice report that combines executive KPIs with breakdowns by year, month, product hierarchy, channel, territory and customer. The screenshots are published as reviewable evidence; the Power BI source file was not supplied.تقرير تطبيقي متعدد الصفحات على Power BI يجمع بين المؤشرات التنفيذية والتفصيل حسب السنة والشهر وتسلسل المنتجات والقناة والمنطقة والعميل. نُشرت لقطات الشاشة كدليل قابل للمراجعة، بينما لم يُرفق ملف Power BI الأصلي.
6. Step-by-step process٦. خطوات التنفيذ
- Reviewed the available sales, product, customer, date and channel fields shown in the report evidence.مراجعة حقول المبيعات والمنتجات والعملاء والتاريخ والقنوات الظاهرة في دليل التقرير.
- Organized the report around sales, cost, gross-profit and margin indicators.تنظيم التقرير حول مؤشرات المبيعات والتكلفة ومجمل الربح والهامش.
- Added time, product-category and channel views for comparison.إضافة تحليلات زمنية ومقارنات حسب فئة المنتج والقناة.
- Used slicers and hierarchy-based exploration to make the report interactive.استخدام المرشحات والتسلسل الهرمي لجعل التقرير تفاعليًا.
- Added a decomposition tree for progressive analysis of sales amount.إضافة شجرة تحليل للاستكشاف التدريجي لقيمة المبيعات.
- Captured the completed report views as portfolio evidence.حفظ لقطات لصفحات التقرير المكتملة كدليل ضمن ملف الأعمال.
7. Screenshots / gallery٧. لقطات الشاشة / المعرض
8. The result / output٨. النتيجة / المخرج
The available evidence shows a working report with multiple analytical views and interactive controls. Business impact, accuracy-validation steps and quantified outcomes were not measured or supplied.يُظهر الدليل المتاح تقريرًا عاملًا يضم عدة زوايا تحليلية وعناصر تحكم تفاعلية. لم تُقَس أو تُرفق نتائج كمية للأثر على الأعمال أو خطوات التحقق من دقة البيانات.
9. What I learned٩. ما تعلمته
Specific learning reflections and next-version improvements are to be added after Hisham documents the dataset, measure logic and validation process.ستُضاف الملاحظات التعليمية وتحسينات النسخة التالية بعد توثيق مجموعة البيانات ومنطق المقاييس وعملية التحقق.